-Amogh Sharma, Research Intern, ICS
Introduction
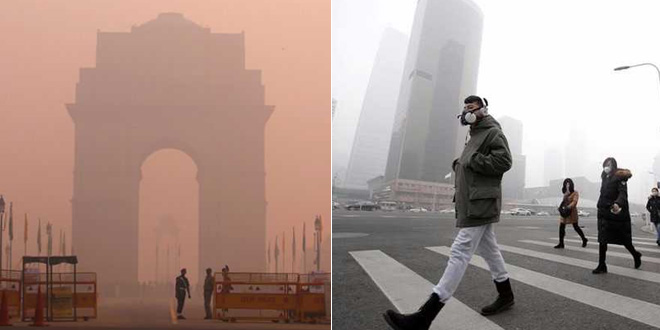
Every winter, newspapers in India are flooded with articles about the national capital, New Delhi, succumbing to haze-filled skies and poor air quality. Citizens are subject to distressing reminders of the increasing pollution, with schools being shut for as long astwo weeks to protect young students from respiratory issues like asthma and pneumonia. Decreased visibility leads to horrific accidents on highways. This seasonal return of poor quality is the smog problem. Another Asian capital, the city of Beijing, was often involved in the same conversation. However, there is a difference in the way the situations were handled in both cities. This blog aims to observe and investigate these differences.
International Guidelines
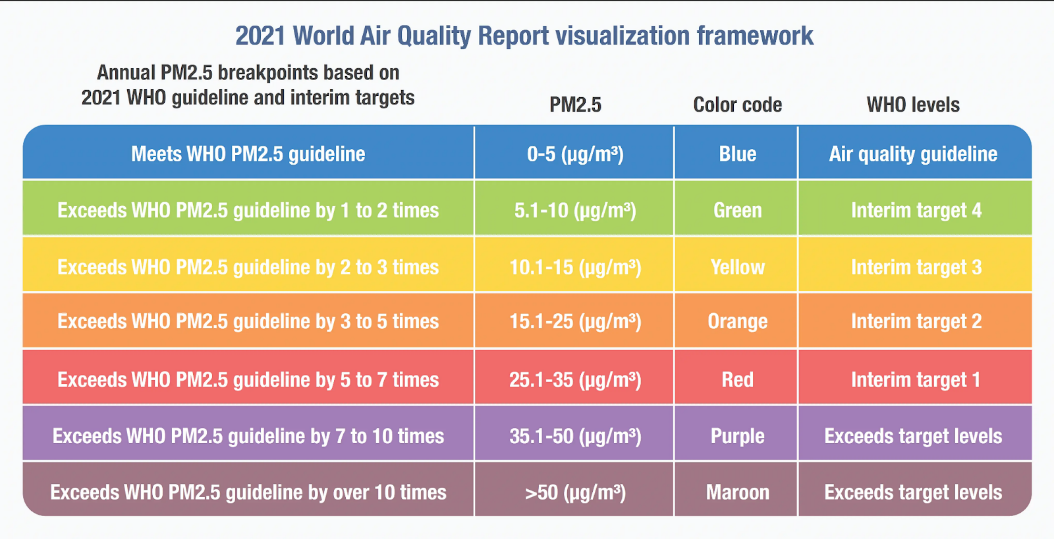
The word smog is a portmanteau of the words smoke and fog. This term was coined in 1905 by Dr Henry Antoine Des Voeux to describe a “smoky fog” in the skies of London. Around the 1950s, the term gained widespread usage to describe the air conditions around London and Los Angeles. In 1987, the WHO published its report[4] on global air quality guidelines for the first time. The guidelines were crafted as quantitative, evidence-based information whose goal is to assist policymakers in creating policies that mitigate the risks posed to public health by air pollution. These guidelines have been regularly updated, the most recent in 2006 and 2021. The quantitative measure used to formulate these guidelines[5] is often the PM2.5 concentration levels in micrograms per cubic meter (µg/m³). PM2.5 is a particulate matter made of particles 25 microns or smaller in diameter. It is considered one of the most dangerous due to its prevalence and harmful effects. PM2.5 particles are released from running vehicles, factory production, stubble burning in agriculture, construction processes, and residential coal burning. Natural events like forest fires and dust storms also release these particles. Although new research says no level of PM2.5 is healthy, the recommended levels are 5 µg/m³. In highly polluted countries, incremental steps of 10, 15, 25 and 35 µg/m³ were recommended by the WHO. Using these stats scientists have been able to correlate the amounts of particles in the air, and corresponding stresses to humans.
China’s Smog Problem: A Case Study of Beijing
By 2008, China was the second-largest energy consumer in the world, but fossil fuels met only 8 per cent of its demand. Increasing population, urbanization, and industrialization increased airborne pollutants immensely. Today, China is the largest producer and consumer of coal, and coal is one of the significant causes of PM 2.5 pollution.
In Beijing, the smog problem can be traced as far back as 600 years. The Chinese language has many terms for ‘smog’, but wumai and hui-mai are the most popular terms. ‘Wumai’ has been used to describe a mixture of smoke and fog for decades, but wumai as a concept of dangerous pollution took weight only recently as in 2013. Researchers at the Chinese Academy of Social Sciences published a report on fighting climate change had pointed out that the haze and smog problem was at the worst it had been since 1961. This event was called the “Great Eastern China Smog”. At the time, Wang Anshun, Bejing’s mayor called the city “unlivable”.
In 2012, 78.6% of energy was provided by coal production. Seven of the top twenty-five cities located in industrialized areas (which were heavily dependent on coal) were in the vicinity of Beijing. The mountain regions to the west and the north blocked this heavy pollution in Beijing, up to 1000 µg/m³ at some points in 2013. Other factors adding to the grey skies over Beijing included vehicular exhaust, crop burning and fireworks.
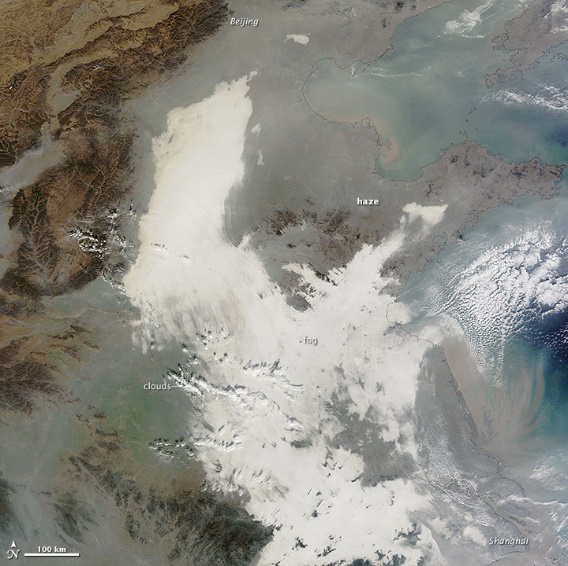
Smog Shrouds Eastern China (nasa.gov)
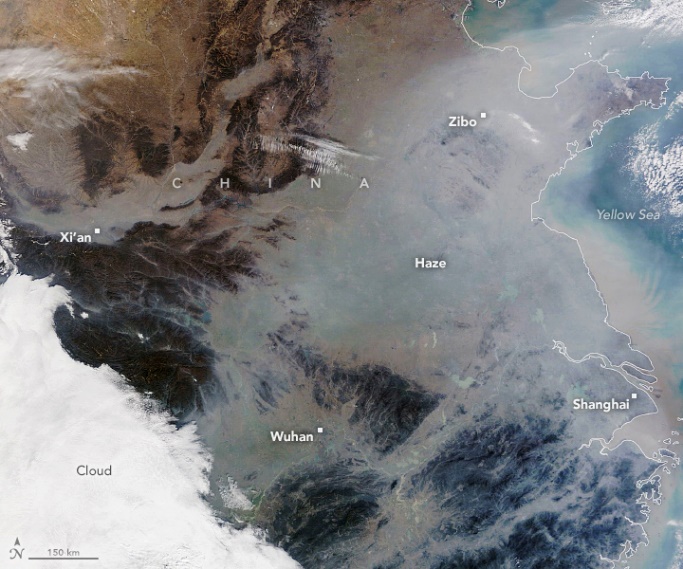
A Winter Haze Over China (nasa.gov)
Beijing’s Plan of Action
To address this severe air pollution crisis, the State Council of China created one of the toughest Air Pollution Prevention and Control Action Plan towards the end of 2013. Three regions were targeted Beijing-Tianjin-Hebei region (BTH), the Yangtze River Delta region (YRD), and the Pearl River Delta region (PRD). The strict regulations entailed rigid industrial emission standards, phasing out small and polluting factories, upgrading the industrial boilers, promoting clean fuels in the residential sector, and strengthening vehicle emission standards.
Between 2013 and 2017, PM2.5
concentrations in Beijing
decreased from 68 µg/m³ to 42 µg/m³. From 2017 to 2021, air
quality improved further in
the next five years to just under 35µg/m³. The regular monitoring and regulation of the action plan showed
marked improvement in the air quality index. In the past ten years, China’s
ranking dropped from the top to 22nd in the PM2.5
concentration rankings. There is
a marked difference in satellite images of the region taken by NASA’s Terra
satellite. However, as Anshun says, the companies that
“irresponsibly relocate”
to neighbouring areas of Hebei and Tianjin are not solving the problem at all.
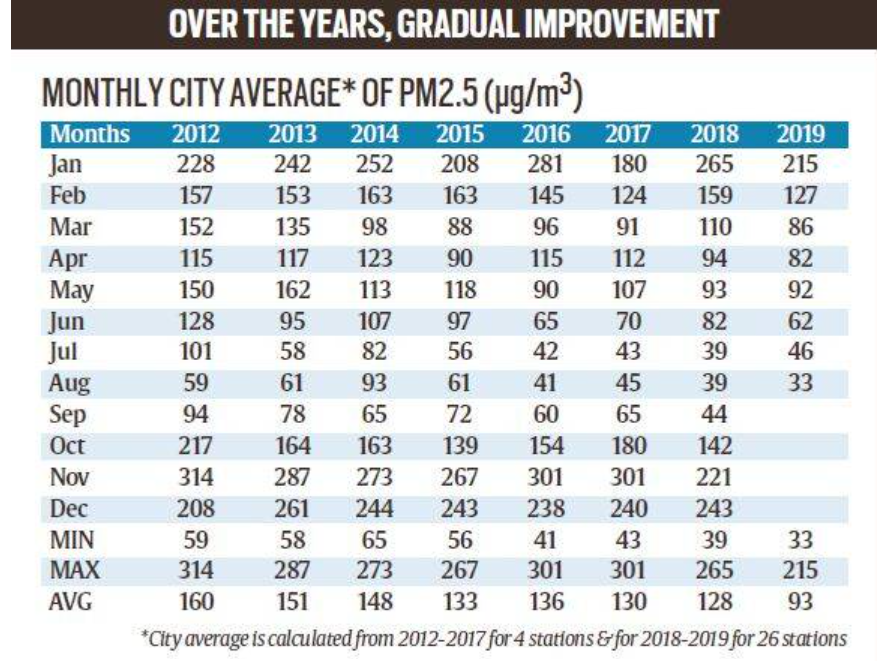
India’s Smog Problem: A Case Study of New Delhi
New Delhi has faced international controversies regarding its air quality for ages. In 2010, concerns were raised about the city prior to its organization of the Commonwealth Games. There was quite an uproar in early 2014 when New Delhi surpassed Bejing as the world’s most polluted city in the Environmental Performance Index. The PM2.5 rating was around 100 in New Delhi, much higher than Beijing’s 68. In 2017, Delhi was once again in the news when the visiting Sri Lankan team refused to play in the adverse conditions. In 2021, this value was 85 for New Delhi, but almost a 50% drop for Beijing at 34.
Between November 1 and 7, 2016, New Delhi faced a Severe Air Pollution Episode (SAPE) called the “Great Indian Smog“. Industrial activities, construction released pollutants, vehicular exhaust gases, dust from roads and power plant emissions were often listed as the principal culprits in this scenario. However, an additional cause was the casual stubble burning by farmers in the neighbouring agricultural belt. Farmers traditionally burn the stubble in their fields yearly to prepare for the subsequent crops. These farmers are reluctant to use more environmentally friendly methods like hiring machines to uproot and roll the stubble back into the field because of the costs involved. NASA’s Terra satellite shows numerous fires burning across the region; the soot mixes with the seasonal fog, creating the harmful smog.
New Delhi’s Plan of Action
India has undeniably made efforts to combat this issue in recent years, including New Delhi’s large fleet of CNG buses. The government added parking fees for nights to discourage driving to work, and the number of metro trains was increased. United effort from government and non-government players has been essential to the changes visible in the capital. The most significant push was provided in 2017 by the GRAP (Graded Response Action Plan) in New Delhi, created by the Central Pollution Control Board. If the air in Delhi were severely polluted for more than 48 hours, trucks would not be allowed to enter the city, and all construction work in the region would be halted. Several similar measures were clearly defined in the plan. Experts believe that the creation of expressways to bypass the city, a ban on PET Coke as industrial fuel, and the introduction of BS-VI fuel have also helped this drop.
In October 2021, while announcing a new ten-point “Winter-Action-Plan” Delhi CM Arvind Kejriwal was quoted as saying that despite the ambitious graded action plan, pollution in Delhi was a direct consequence of stubble burning in neighbouring states. A collaborative plan is of absolute necessity.
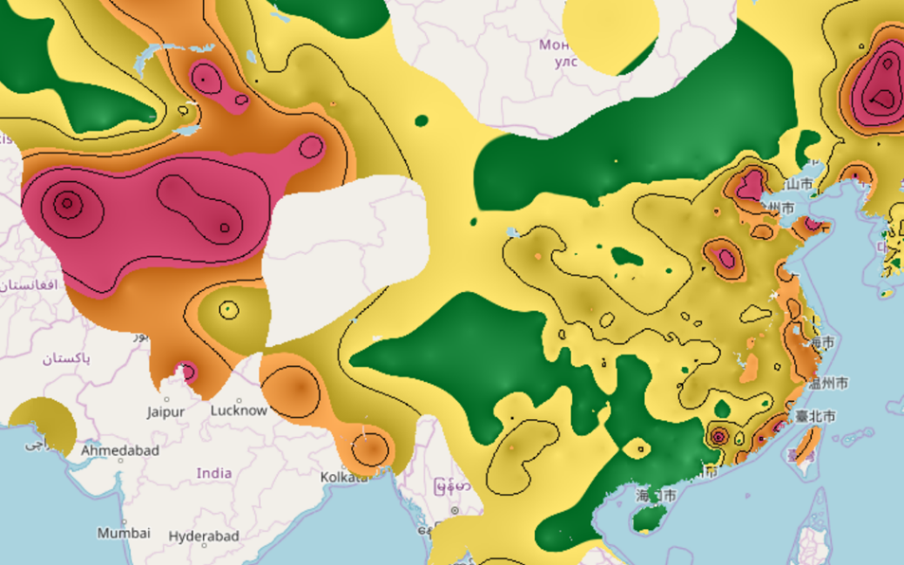
Red is unhealthy, Orange is unhealthy for sensitive groups, Yellow is moderate, Green is good.
There is still a long way to go for both countries.
A recent satellite image from Berkeley-Earth’s website shows us the levels of pollution still present in these regions. The governments in both cities had set ambitious targets, but even these are too small to counter the devastating effects. Even as recent as April 2022, Delhi is a stark maroon and there is a similar story for Beijing. At some point, the nations have to decide between their extensive development and competitive strategies and take a far-sighted approach. It is increasingly important to shift from just bringing down a mere stat like PM2.5 or AQI, and listen to the people who suffer every day because of it.
Conclusions
However, there is a marked difference in how these crises were handled in Beijing and New Delhi. Beijing favoured a heavy top-down approach, and similar strategies cannot be applied in New Delhi. For example, the “Parade Blue” phenomenon in Beijing, where stringent policing by the Chinese government makes for clear skies around special events. Such measures are not possible in India, whereas in Bejing, it was censored from the internet. In an authoritative political regime, it is easier to enforce rulings without opposition. It, however, remains to be seen how New Delhi is able to adopt a participative approach to tackle this issue in the Indian context.
The Blog was written under the guidance and supervision of Dr. Mirza Zulfiqur Rahman,Independent Researcher and Consultant (International Relations, Transboundary Rivers and Borders) and Visiting Faculty (Tata Institute of Social Sciences, Guwahati). The views expressed here are those of the author(s), and not necessarily of the mentor or the Institute of Chinese Studies.